Key Takeaways
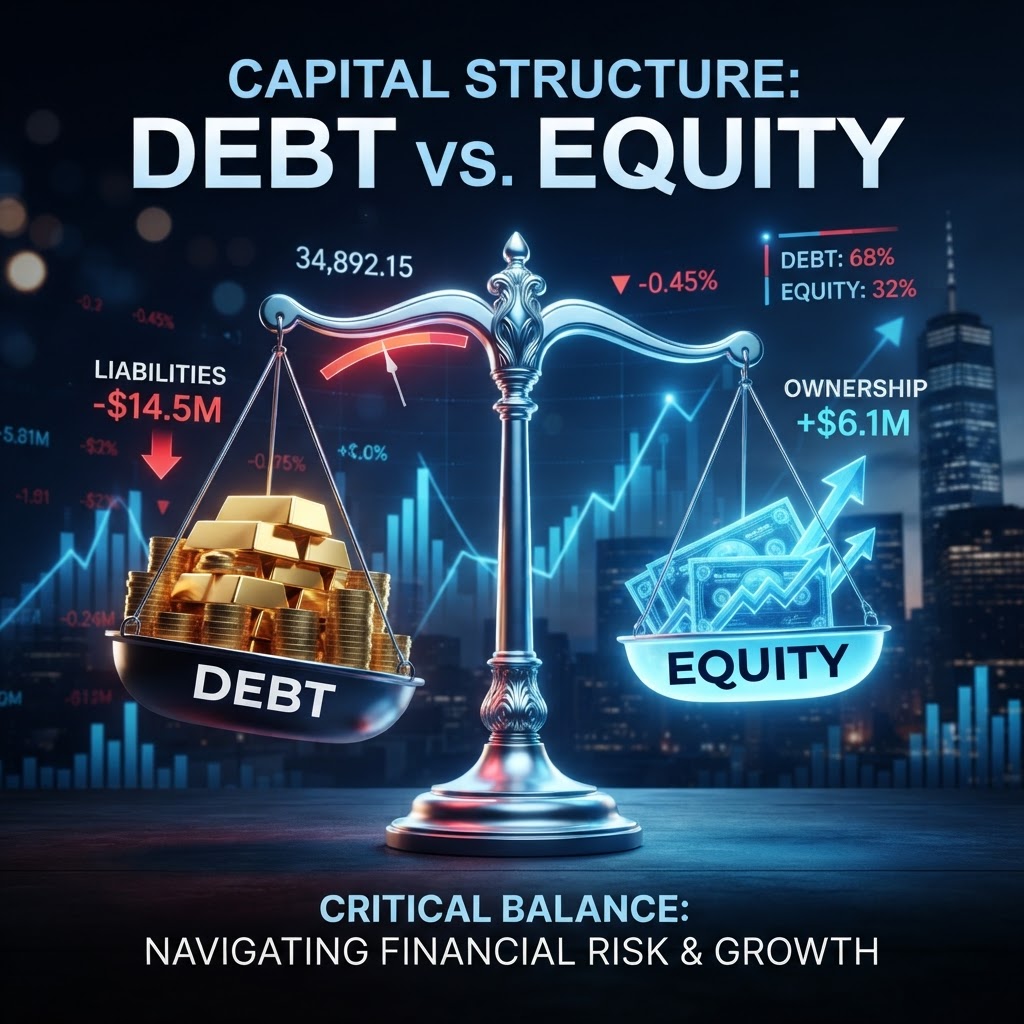
- The Debt-to-Equity (D/E) ratio is a primary metric for assessing how much of a company's operations are financed by debt versus shareholder equity.
- A high D/E ratio indicates aggressive financing, which can amplify returns during growth cycles but poses significant risks during economic downturns.
- Investors should evaluate D/E ratios within the context of specific industries, as capital-intensive sectors naturally carry more debt.
What the Debt-to-Equity Ratio Tells Us
For any retail investor analyzing an Indian company, the balance sheet serves as the ultimate scorecard. Among the various metrics, the Debt-to-Equity (D/E) ratio stands out as a critical indicator of financial health. It measures the proportion of total liabilities to shareholders' equity, effectively revealing how much leverage a company has employed to fund its growth.
At its core, the formula is simple: divide total liabilities by total shareholder equity. A lower ratio generally signals a more conservative, self-funded business model, while a higher ratio suggests the company is leaning heavily on creditors to fuel its expansion.
Why It Matters: Risk vs. Reward
Leverage is a double-edged sword. When a business is thriving, taking on debt can enhance the Return on Equity (ROE) because the firm uses borrowed money to generate profits that exceed the interest costs. However, in the Indian market, where interest rate cycles can be volatile, high leverage creates a 'fixed-cost' burden.
If a company has a high D/E ratio, a slowdown in revenue can quickly turn into a liquidity crisis. Fixed interest payments must be met regardless of whether the business is profitable, making highly leveraged firms far more sensitive to macroeconomic shocks or fluctuations in the cost of capital.
The Bigger Picture: Sectoral Context
It is a fundamental error to compare the D/E ratios of two companies across different industries. Capital-intensive sectors like Infrastructure, Utilities, or Manufacturing often require massive debt to build assets. In these spaces, a D/E ratio of 1.5 or 2.0 might be standard.
Conversely, IT services or FMCG firms typically operate with asset-light models, often maintaining a D/E ratio close to zero. Analyzing these ratios requires sector-specific benchmarking. Always look at the trend over the last 3-5 years; a company that is consistently reducing its D/E ratio is often signaling a shift toward balance sheet deleveraging, which market participants frequently view as a sign of management maturity.
What to Watch Next
As you assess your portfolio, look beyond the current snapshot. Examine whether the debt is being used for unproductive cash burning or for revenue-generating capacity expansion. In a rising interest rate environment, debt-heavy firms often see their net profit margins compressed. Keep a close eye on the interest coverage ratio alongside D/E to understand how comfortably a firm can service its existing debt obligations.
⚠️ Disclaimer: IndiaMarketInsights.com is NOT a SEBI-registered Investment Adviser, Research Analyst, or Investment Advisory firm. This article is published for educational and informational purposes only and does not constitute investment advice, an offer to buy or sell, or a recommendation of any security or financial product. All data and information referenced is sourced from publicly available news and filings. Please consult a SEBI-registered investment advisor before making any investment decision. Past performance is not indicative of future results. Investing in securities involves risk, including possible loss of principal.