Key Takeaways
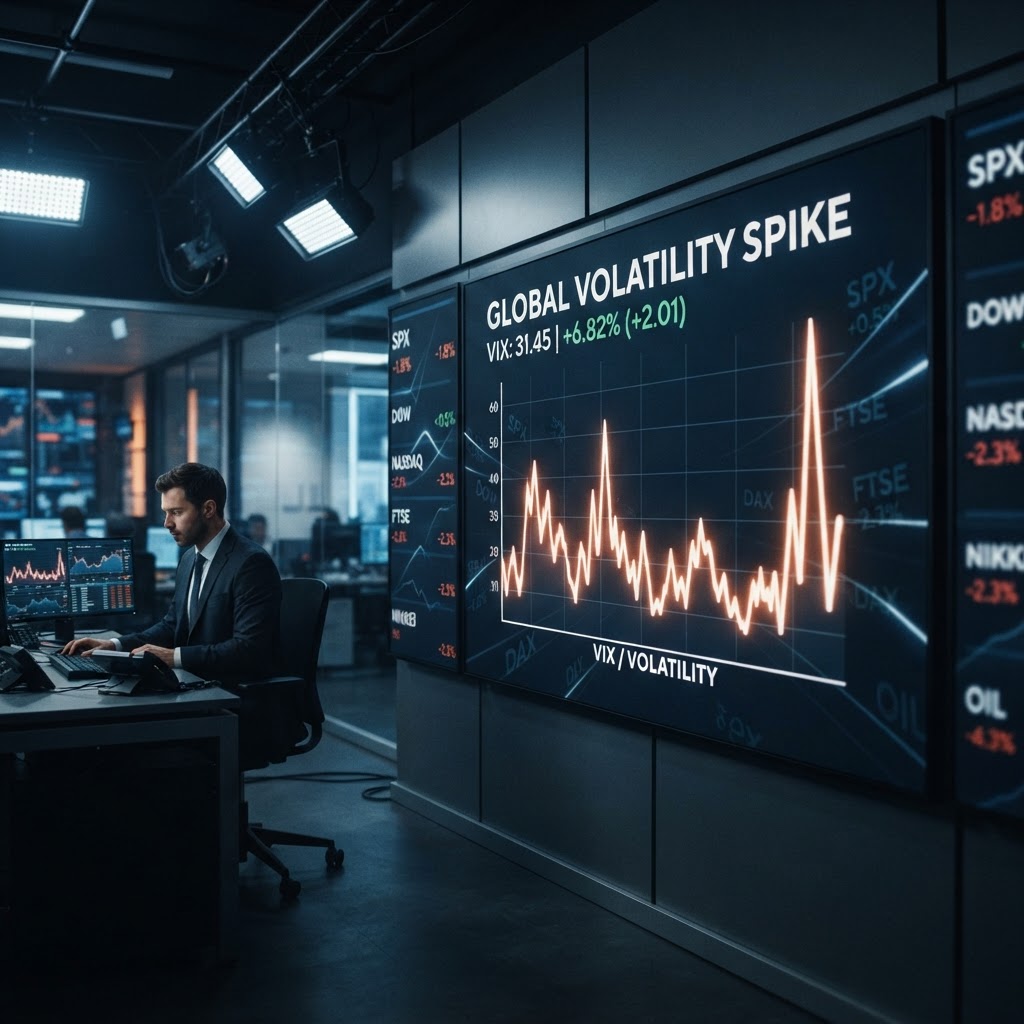
- The India VIX (Volatility Index) serves as a barometer for market expectations of near-term volatility.
- It is derived from Nifty 50 option prices, reflecting the market's anticipation of price swings.
- A higher VIX typically indicates rising uncertainty and fear, while a lower VIX suggests investor complacency.
- Understanding the VIX helps investors gauge the cost of hedging and the overall risk environment, rather than predicting specific market direction.
What is the India VIX?
In the world of Indian equity markets, the India VIX—or the Volatility Index—is frequently cited as the 'fear gauge.' Unlike the Nifty 50, which tracks the price performance of the top 50 companies, the India VIX is a forward-looking indicator. It represents the market's expectation of volatility over the next 30 calendar days.
Calculated based on the order book of Nifty 50 options, the VIX quantifies how much participants are willing to pay for protection. When traders anticipate turbulent times ahead, they bid up the premiums on option contracts, which in turn causes the VIX to rise. Conversely, when the market is perceived to be stable, option premiums tend to be lower, dragging the index down.
Why It Matters: The Psychology of Volatility
To the retail investor, the India VIX offers a window into market sentiment. It is not a directional tool; it does not tell you if the market will go up or down. Instead, it tells you how 'loud' or 'intense' the market expects the ride to be.
High VIX levels often coincide with periods of panic or significant negative news events. During such times, the cost of buying put options increases, reflecting the demand for insurance against a portfolio drawdown. For long-term investors, monitoring the VIX is useful for assessing the general risk climate, ensuring that investment strategies align with current market temperament.
The Bigger Picture: Complacency vs. Panic
Market veterans often look at the VIX to detect extremes in sentiment. Historically, an unusually low VIX can indicate a state of complacency, where investors feel so secure that they may overlook potential risks. On the other end of the spectrum, an extreme spike in the VIX often marks a point of 'peak fear,' which contrarian observers sometimes correlate with potential stabilization periods.
It is important to remember that the India VIX is a mathematical calculation based on market-wide option pricing. It is a reflection of collective human behavior under uncertainty. By observing the VIX, you are essentially looking at the collective cost of 'fear' in the derivatives market.
What to Watch Next
As you navigate the markets, watch how the India VIX reacts to major macroeconomic announcements or significant quarterly earnings cycles. While it is tempting to use the VIX to time the market, it is far more effective as a tool for risk management and understanding the environment in which your portfolio operates. Stay objective, look for divergences between price trends and volatility levels, and always prioritize long-term asset allocation over short-term market noise.
⚠️ Disclaimer: IndiaMarketInsights.com is NOT a SEBI-registered Investment Adviser, Research Analyst, or Investment Advisory firm. This article is published for educational and informational purposes only and does not constitute investment advice, an offer to buy or sell, or a recommendation of any security or financial product. All data and information referenced is sourced from publicly available news and filings. Please consult a SEBI-registered investment advisor before making any investment decision. Past performance is not indicative of future results. Investing in securities involves risk, including possible loss of principal.