Key Takeaways
- The India VIX is a volatility index that represents the market's expectation of volatility over the next 30 days.
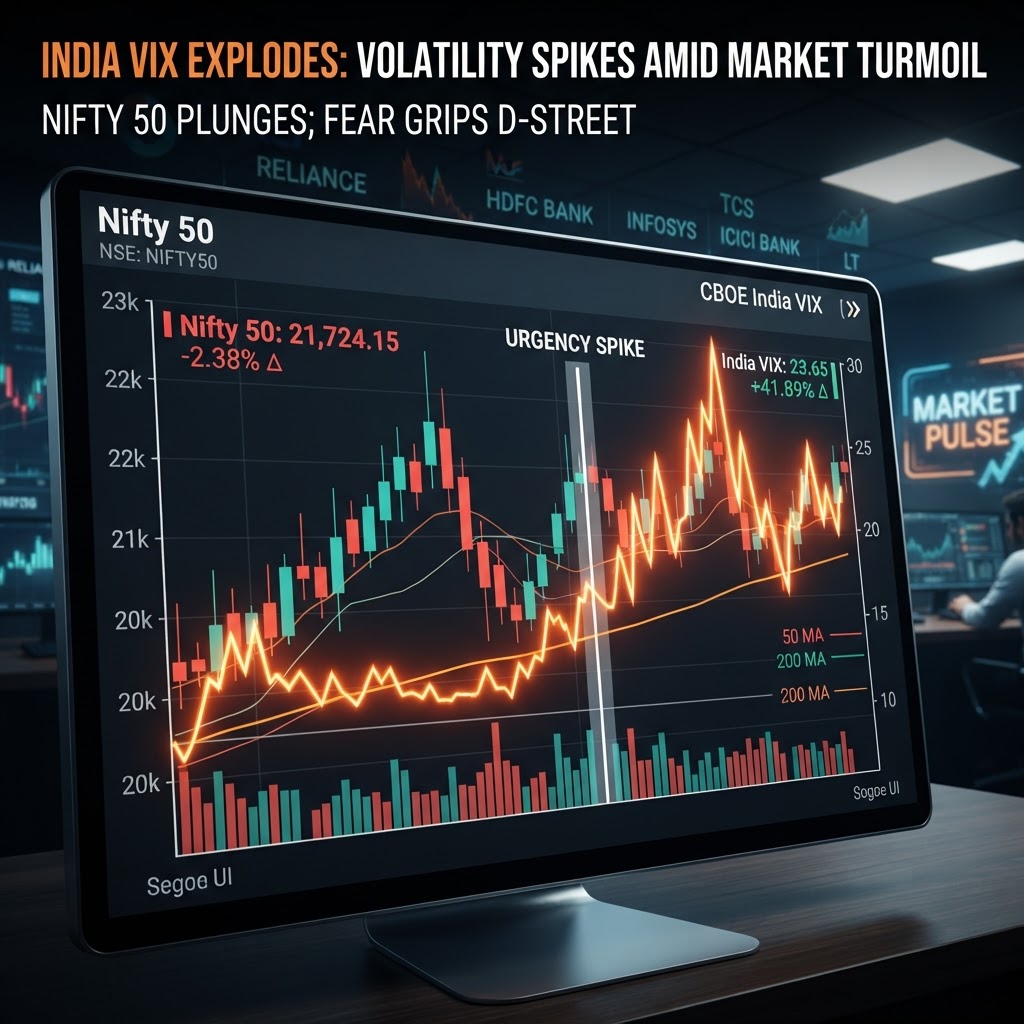
- Often referred to as the 'fear gauge,' it is derived from Nifty 50 index option prices.
- A rising VIX typically signals market uncertainty, while a falling VIX suggests stability or complacency.
- Understanding this metric helps investors contextualize market swings, but it does not predict the direction of the market.
What is the India VIX?
The India VIX, or Volatility Index, serves as a critical barometer for the Indian stock market. It quantifies the market's expectation of near-term volatility based on the trading of Nifty 50 index options. Essentially, it reflects how much 'movement' investors anticipate in the Nifty index over the upcoming 30-day period.
Unlike stock prices that tell you where the market is, the India VIX provides a glimpse into the collective sentiment of market participants. It is a forward-looking indicator calculated using the bid and ask quotes of out-of-the-money and near-the-money Nifty option contracts.
Why It Matters: The Psychology of Fear
Market participants often label the India VIX as a 'fear gauge.' This is because periods of high market stress or uncertainty usually drive up the premiums of option contracts, leading to a higher VIX reading. When traders are nervous about potential downside risks, they pay more for 'put' options, which increases the volatility calculation.
Conversely, when the VIX is low, it reflects a environment of relative calm or, in some cases, investor complacency. A stable or declining VIX suggests that market participants do not foresee drastic shifts in the index, leading to lower option premiums.
The Bigger Picture: Correlation vs. Causation
It is vital to distinguish between volatility and direction. A common misconception is that a rising India VIX automatically means the market will crash. In reality, the VIX measures the intensity of expected price swings, regardless of whether those swings are upward or downward. However, historically, sharp market corrections are often accompanied by a spike in the VIX, as fear and uncertainty intensify.
For retail investors, the VIX is a tool for context. During periods of heightened volatility (a high VIX), portfolio fluctuations tend to be more pronounced. Recognizing this can help investors maintain a long-term perspective rather than reacting impulsively to short-term noise.
What to Watch Next
As you monitor your portfolio, pay attention to the relationship between the Nifty 50 and the India VIX. Often, they display an inverse relationship—markets tend to rise as the VIX declines, and vice-versa. While this is not a hard rule, keeping an eye on the VIX can provide a better understanding of the 'temperature' of the market environment.
⚠️ Disclaimer: IndiaMarketInsights.com is NOT a SEBI-registered Investment Adviser, Research Analyst, or Investment Advisory firm. This article is published for educational and informational purposes only and does not constitute investment advice, an offer to buy or sell, or a recommendation of any security or financial product. All data and information referenced is sourced from publicly available news and filings. Please consult a SEBI-registered investment advisor before making any investment decision. Past performance is not indicative of future results. Investing in securities involves risk, including possible loss of principal.