Key Takeaways
- The India VIX is a volatility index representing the market's expectation of volatility over the next 30 days.
- Often called the 'fear gauge,' it is derived from the order book of Nifty 50 index options.
- A rising VIX typically signals market uncertainty, while a falling VIX indicates a period of relative stability.
- Understanding the VIX helps investors avoid emotional decision-making during periods of high market turbulence.
What is the India VIX?
The India Volatility Index, or India VIX, serves as a crucial barometer for the Indian stock market. It provides a numerical representation of the market's perception of risk and volatility over the upcoming 30-day period. Unlike traditional price indices that track the value of stocks, the VIX tracks the 'implied volatility' baked into option premiums for the Nifty 50. In simple terms, it measures how much traders expect the Nifty to move.
Why the VIX Matters to Retail Investors
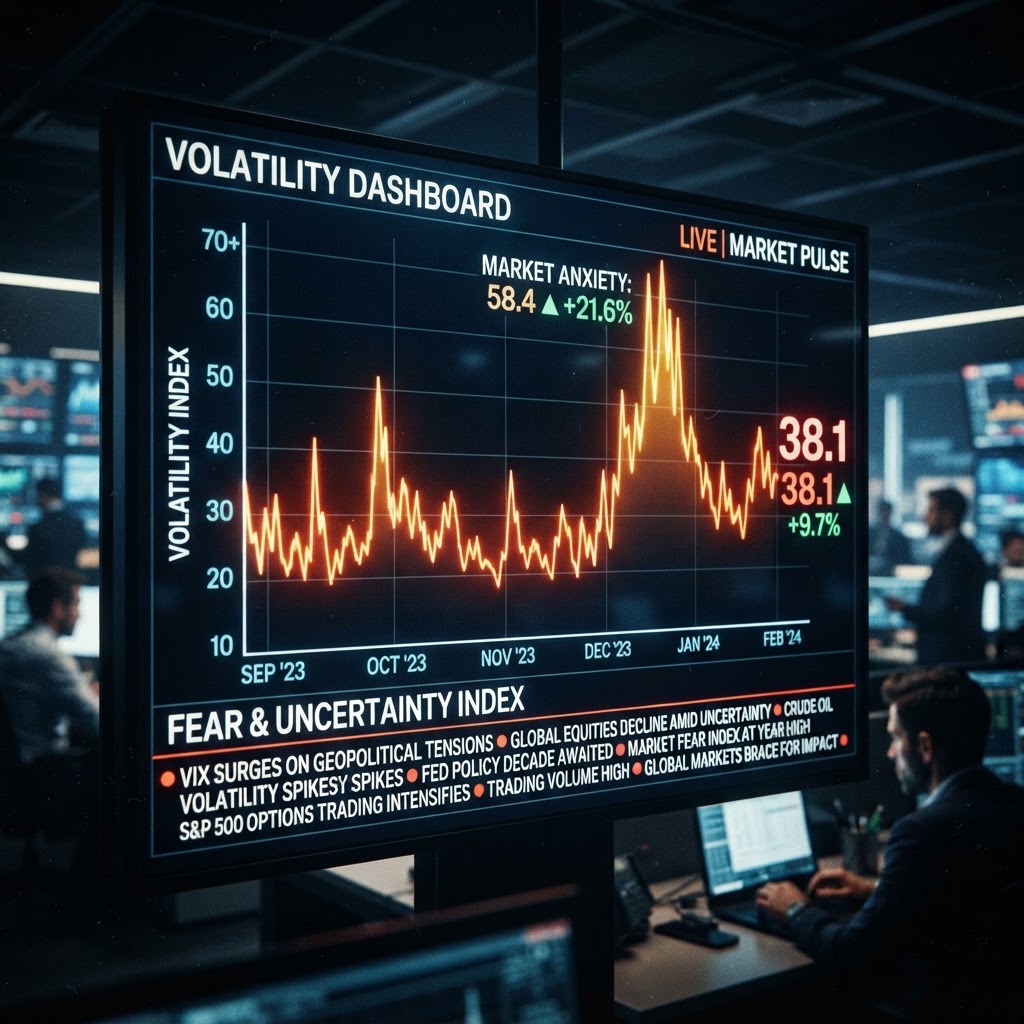
For the retail investor, the India VIX acts as a sentiment indicator. When the index is low, it suggests that market participants are generally complacent or optimistic, anticipating stable market conditions. Conversely, when the VIX spikes, it is a clear signal that the market is bracing for sharp swings or potential shocks. Institutional investors use this data to hedge their portfolios, while retail investors often look to it to gauge whether the market is entering a phase of 'fear' or 'greed.'
The Relationship Between Fear and Options Pricing
The mechanics of the India VIX are rooted in the options market. When investors are fearful of a downturn, they rush to buy put options as a form of insurance, which drives up the prices of these contracts. Because the VIX is calculated based on these option prices, the index value rises automatically when there is a surge in demand for hedging. It is not a predictor of market direction—the market can rise while volatility remains high—but it is an excellent measure of the intensity of market sentiment.
Putting Volatility into Perspective
It is a common misconception that high volatility is always a sign of a market crash. While the VIX tends to spike during negative news cycles or economic uncertainty, it can also reflect 'two-way' volatility where prices swing significantly in both directions. For long-term investors, the VIX is a tool for context. During periods of extremely high VIX levels, the market is essentially pricing in high risk, which often coincides with emotional selling or speculative frenzy. Experienced market participants monitor these levels to distinguish between a temporary blip and a sustained shift in macro sentiment.
What to Watch Next
Moving forward, keeping an eye on the India VIX is less about timing the exact bottom of the market and more about assessing the risk environment. Investors should observe how the VIX reacts to key economic data releases and earnings seasons, as these events typically provide the catalysts for shifts in implied volatility. Maintaining a disciplined approach remains the most effective strategy regardless of where the volatility index sits on the screen.
⚠️ Disclaimer: IndiaMarketInsights.com is NOT a SEBI-registered Investment Adviser, Research Analyst, or Investment Advisory firm. This article is published for educational and informational purposes only and does not constitute investment advice, an offer to buy or sell, or a recommendation of any security or financial product. All data and information referenced is sourced from publicly available news and filings. Please consult a SEBI-registered investment advisor before making any investment decision. Past performance is not indicative of future results. Investing in securities involves risk, including possible loss of principal.